Raphael: js library for Scalar Vector Graphics
I don't do much (web) front-end design usually, although often I find it vital to visualize my ideas using some sort of basic but functional UI-kit. Well, if you're like me, you'll probably be happy to know about Raphael. This is a javascript library that sits on top of the SVG specifications and provides a set of (very straighforward) APIs for creating vector graphics and animations in most browsers.
Scalable Vector Graphics (SVG) is a family of specifications of an XML-based file format for describing two-dimensional vector graphics, both static and dynamic (i.e. interactive or animated). The SVG specification is an open standard that has been under development by the World Wide Web Consortium (W3C) since 1999. SVG images and their behaviors are defined in XML text files. This means that they can be searched, indexed, scripted and, if required, compressed. Since they are XML files, SVG images can be created and edited with any text editor, but specialized SVG-based drawing programs are also available.
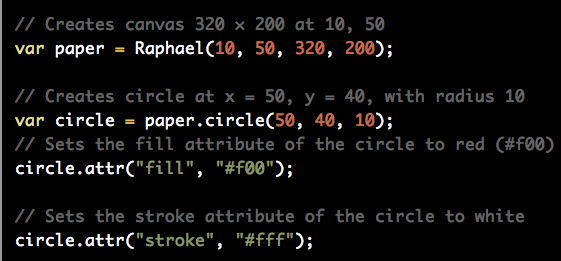
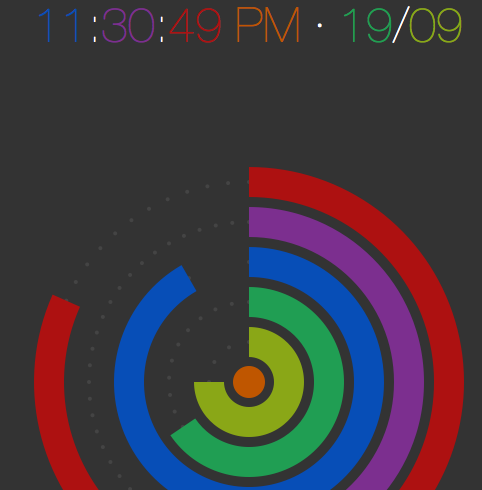
Writing SVG stuff can be very painful, but using Raphael it almost becomes fun. The official site gives you various examples (eg check out the slick polar clock, or the diagram elements), and code that shows how easy it is to get started:
Looking forward to spend more time on this. For now, I've just collected a few good learning resources about it, which I thought I'd share:
- The official homepage, which contains various examples and all the documentation
- An Introduction to the Raphael JS Library: a nice blog post that shows how to build a little mood meter from the ground up
- Another blog post showing how to create a typical "progress throbber", as seen in Apple interfaces, with a few lines of code
- Raphael Live: a simulator of the js library, for testing your code easily within a browser's window
- Lots of categorized raphael examples at www.irunmywebsite.com
- An interesting discussion about the advantages of Raphael vs jQuery SVG (also, make sure you check out all the questions tagged 'raphael' at stackoverflow)
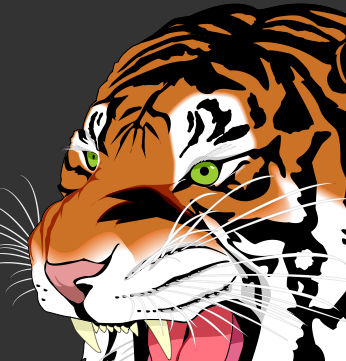
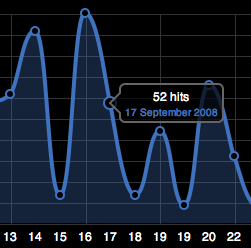
Below, some screenshots of a fancy clock, a tiger, and a graph, all built entirely via Raphael.
..
Cite this blog post:
Comments via Github:
See also:
2012


