These days there are a lot of browser-oriented visualization toolkits, such d3.js or jit.js. They look great and are easy to use, but how much do they scale when used with medium or large hierarchical datasets?
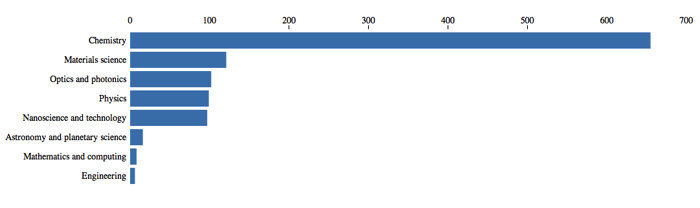
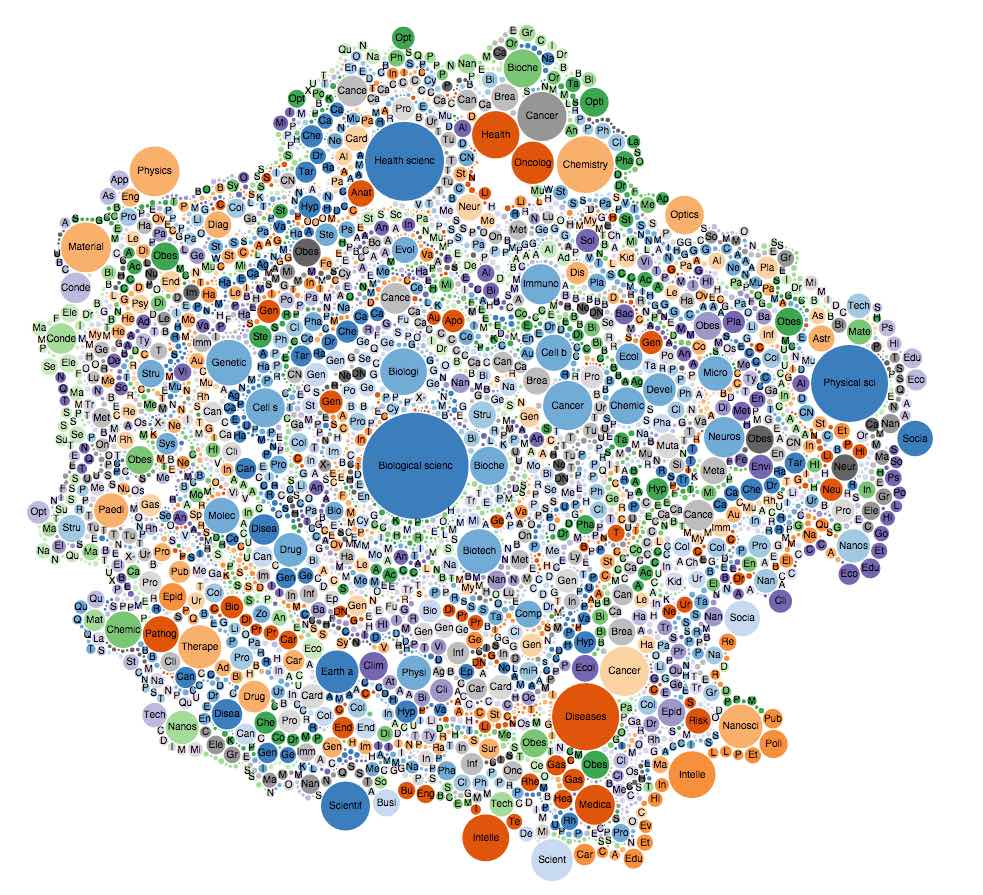
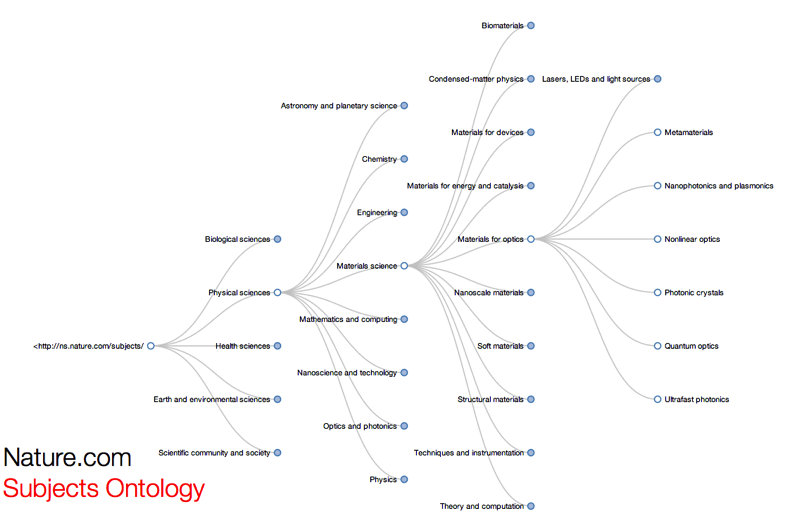
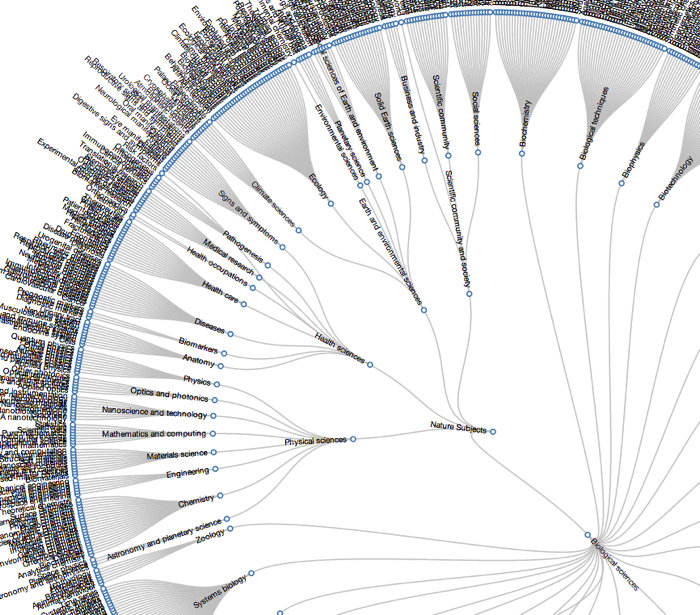
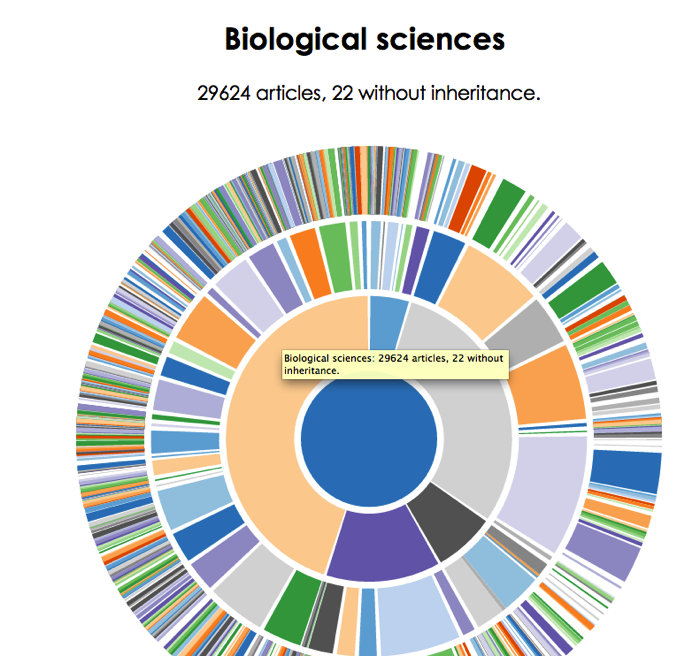
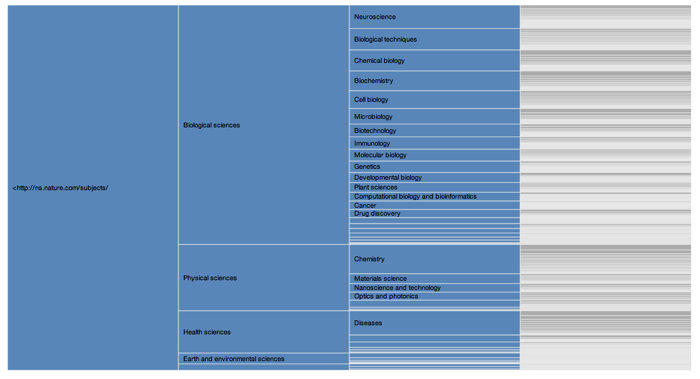
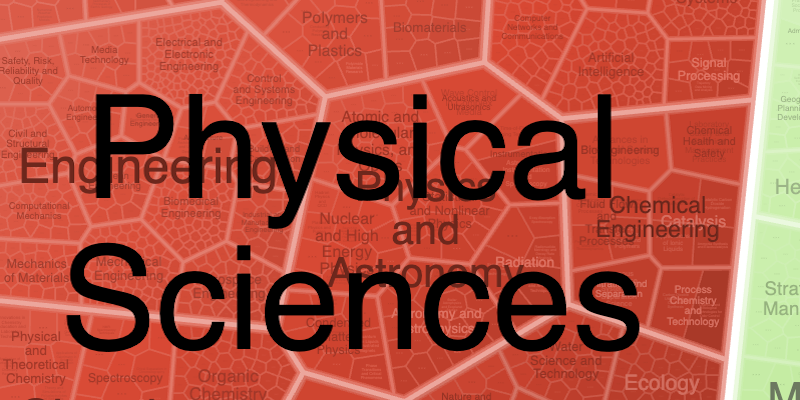
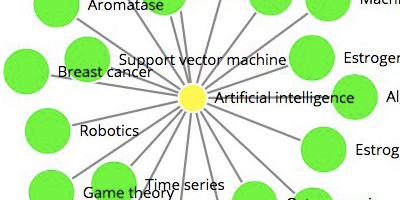
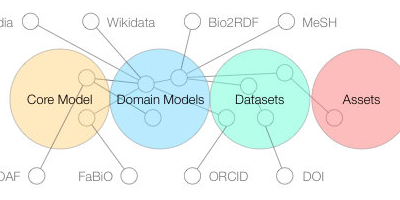
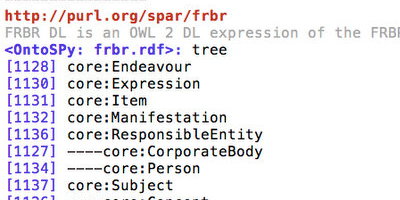
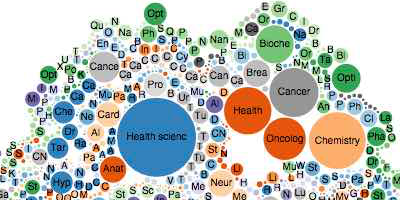
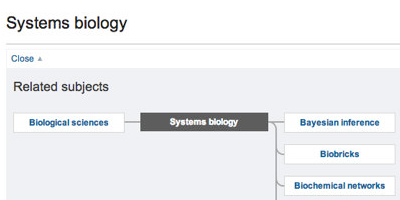
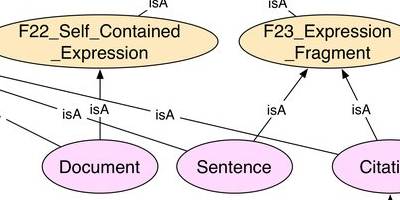
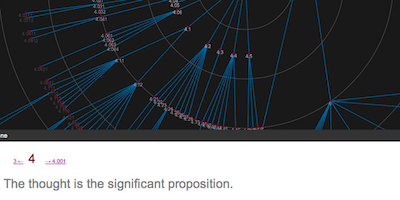
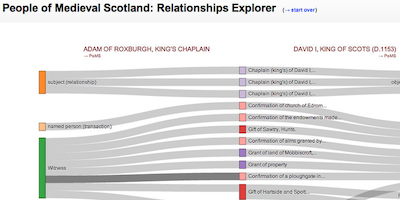
This application was created to test some of these visualization frameworks in particular by attempting to display the nature.com 'subject ontology' - a quite large (~2500 concepts) multi-hierarchical taxonomy made available by Nature Publishing Group in order to describe the topic(s) of a scientific publication.
Role:
Design and development
Date: Jan 2014 - Oct 2014
Link: http://hacks.michelepasin.org/nature/subjectsviz/
Link: Messing around wih D3.js and hierarchical data (blog post)
Date: Jan 2014 - Oct 2014
Link: http://hacks.michelepasin.org/nature/subjectsviz/
Link: Messing around wih D3.js and hierarchical data (blog post)
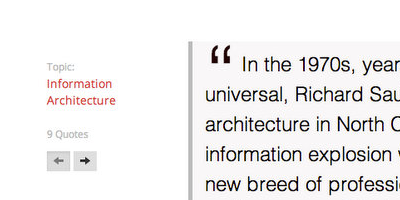
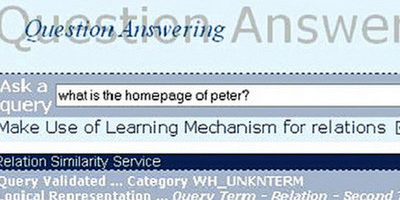
Screenshots: