Navigating through the people of medieval Scotland... one step at a time
Navigating through the people of medieval Scotland... one step at a time! This is, in a nutshell, what users can do via the Dynamic Connections Cloud application, a prototype tool I've been working on recently, in the context of the People of Medieval Scotland project (PoMS), which was launched last week at the University of Glasgow.
Traditionally, digital humanities projects that produce historical databases tend to present their data using a classic tabular format, which is roughly the equivalent of a bibliographic record (e.g., as used in library software) but for historical data (e.g., to present information about persons, documents, facts).
This approach has the advantage of offering a wealth of information within a clean and well organised interface, thus simplifying the task of finding what we are looking for during a search. However, by combining all the data in a single view, this approach also hides some of the key dimensions used by historians in order to make sense of the materials at hand. For example, such dimensions could be deriving from a higher-level analysis that focuses on spatio-historical, genealogical or socio-political patterns.
The limitations of the tabular format become even more evident when we consider that the PoMS database contains more than 80000 facts about 20000 people/institutions active in medieval Scotland. How were these people connected? Can we explore this network in a more interactive, game-like manner than the classic database-like structures? In other words, how can we help users see the 'big picture'?
PoMS Laboratories
PoMS researchers have sifted through more than 8,000 charters and have extracted an amazing amount of information from them. Now that the database is online and can be searched via the usual mechanisms (keywords, facets), historians can investigate aspects of the making of Scotland in a small fraction of the time it would have taken them otherwise. However, almost paradoxically, by making available such a large quantity of data in structured format, new problems are arising too. Information overload is one of them: how can this wealth of data be compared, correlated, and organized into more meaningful units? How can we present the same data in a more piecemeal fashion, according to predefined pathways or views on the dataset that aim at making explicit some of the coherence principles of the historical discourse?
In order to investigate these questions further, in the last few months I developed the PoMS Labs, a section of the PoMS website that contains a number of prototypes for interacting with PoMS data in innovative ways. In general, with these tools we aimed at addressing the needs of both non-expert users (e.g., learners)—who could simultaneously access the data and get a feeling for the meaningful relations among them—and experts alike (e.g., academic scholars)—who could be facilitated in the process of analyzing data within predefined dimensions, so as to highlight patterns of interest that would otherwise be hard to spot.
What follows contains more information about three of these prototype tools, which I think will give you a pretty good idea of what the concept of highlighting pathways in the data means (by clicking on launch you can try out the tools for yourself - which is probably the best way to discover what this is all about!).
Note: currently the only platforms we tested the Labs on are desktop computers running the latest versions of Mozilla Firefox, Google Chrome or Apple Safari.
1. Dynamic Connections Cloud (launch)
This experimental app lets you browse incrementally the network of relationships linking persons/institutions to other persons/institutions. Since each of them is normally participating in more than one event (e.g., a transaction or a relationship factoid), we can attempt to reconstruct the network of interconnections by examining the appearance of individuals within the same event or situation.
The software lets you choose an individual and start building a 'chain of connections' departing from him/her/it. Each name in the resulting connections-cloud is rendered using a different font and color, depending on the sex and on the number of common factoids being shared with the previously selected items. At any time it is possible to go back to the main PoMS database pages in order to find out more about the individuals or factoids emerging from the connections-cloud exploration. Just click on the individual icons, or move the mouse over the links provided in order to discover more options.
The screenshot below illustrates the main functionalities of the software, and is based on a sample connection chain that starts from a rather unknown person ('A. wife of Normam son of Malcolm') and arrives to a more famous institution ('Arbroath Abbey').
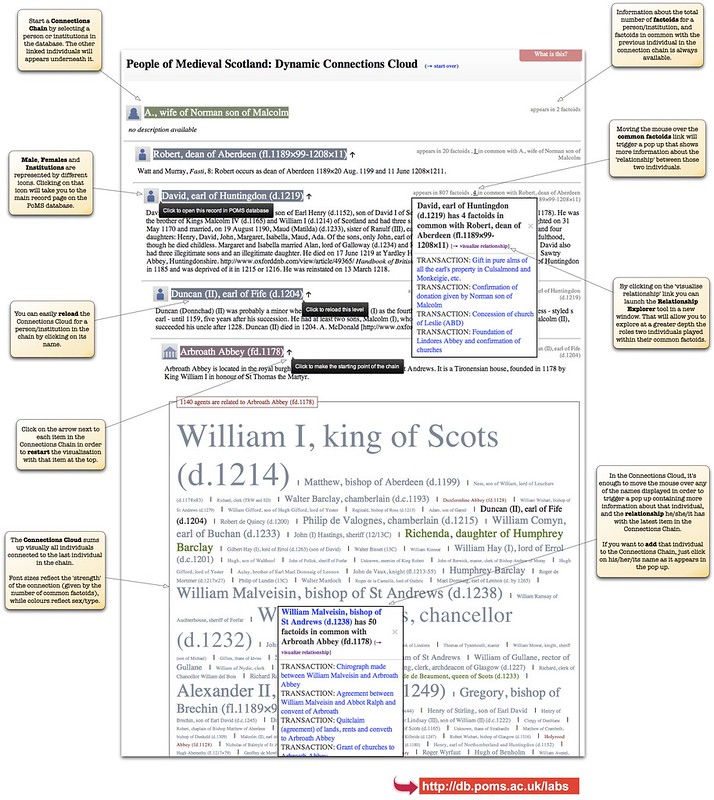
Note: You can see a live version of the connection chain displayed above by following this link.
2. Relationships explorer (launch)
The individuals and institutions in the PoMS database are often interconnected by participating in the same events (e.g., transactions or relationships). In particular, the database contains detailed information about the varying roles agents are playing within such events. Can we discover any interesting patterns by examining these roles? For example, do agents tend to appear always in the same role, or are there exceptions to this rule?
This visualization tool allows you to compare the different roles played by two agents in the context of their common events. The software makes use of the D3 Sankey diagrams plugin, kindly made available by Mike Bostock. In general, Sankey diagrams are designed to show flows through a network (and are sometimes called flow diagrams). In our case, the network is always composed of three steps (person-role, event, person-role) and is relatively simple, so the Sankey diagram is mainly used to group nodes of the same type (e.g., roles) and provide an overview of relationships between persons and events (i.e., the 'flow').
The screenshot below illustrates the main functionalities of the software; in particular, it represents all existing relationships between Edward I, king of England (d.1307) and William Fraser, bishop of St Andrews (d.1297) (obviously, based on the information PoMS makes available).
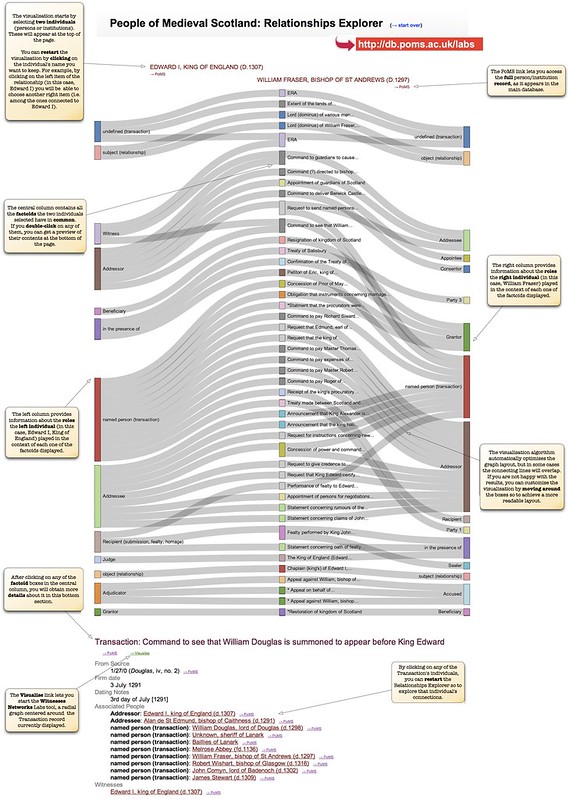
Note: you can play with a live version of the specific visualisation displayed above by following this link.
3. Transactions and Witnesses (launch)
In PoMS, witnesses are very important as they are the persons who have witnessed a charter and are given in the witness list. Charters are usually describing some form of transaction, which is the most important type of event ('factoid') represented in the database. This interactive visualization lets you browse iteratively through transactions and the witnesses associated with them.
Each graph starts from a transaction of choice (the 'focus point'), and displays two levels of information: (1) all the witnesses of the transaction (normally persons or institutions), and (2) for each of these agents, all the other transactions they have witnessed. The new transactions emerging from this network can be selected and brought to the center of the visualization (which is recalculated), thus facilitating a process of interactive exploration of the interconnections and commonalities among PoMS's recorded transactions.
The visualization has been created thanks to the freely available JavaScript InfoVis Toolkit.
The screenshot below illustrates the main functionalities of the software; the graph is centered around a transaction ('Agreement between Alwin, abbot of Holyrood, and Arnold, abbot of Kelso, over the Crag of Duddingston in Edinburgh') that has five witnesses in total.
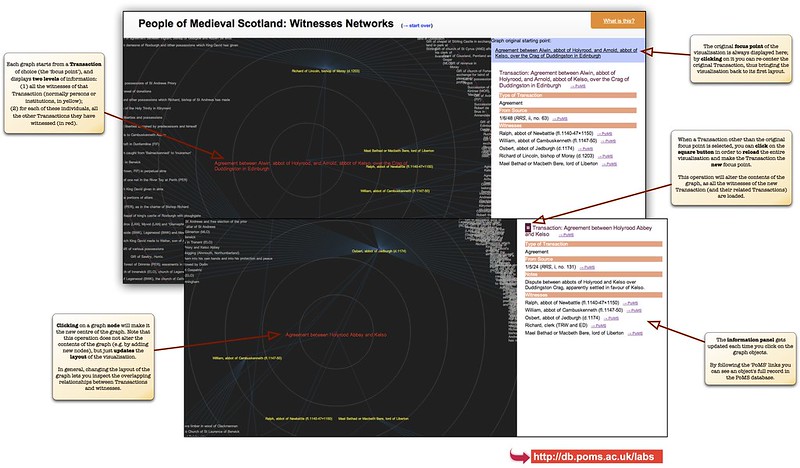
Note: click here to see a live version of this graph.
Any feedback?
Then please do get in touch, either through this blog or the official PoMS contact page! This is all very much a work in progress, so we're eager to hear from you.
Cite this blog post:
Comments via Github:
See also:
2021
2013
New Perspectives on Medieval Scotland: 1093-1286, Woodbridge, Suffolk: Boydell and Brewer, Studies in Celtic History Series, Aug 2013.
2012
Digital Humanities 2012, Hamburg, Germany, Jul 2012.
2011
paper Browsing highly interconnected humanities databases through multi-result faceted browsers
Digital Humanities 2011 , Stanford, USA, Jun 2011.
2009
2007
paper Supporting Philosophers’ Work through the Semantic Web: Ontological Issues
Fifth International Workshop on Ontologies and Semantic Web for E-Learning (SWEL-07), held in conjunction with AIED-07, Marina Del Rey, California, USA, Jul 2007.
2006
paper An ontology for the description and navigation through philosophical resources
European Conference on Philosophy and Computing (ECAP-06), Trondheim, Norway, Jun 2006.