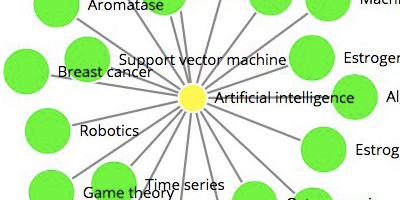
A Python tool that streamlines the process of creating scientific networks visualizations, by using data from Dimensions on Google BigQuery.
The main output visualization is using the open source VOSviewer package. More visualizations will be added in the future.
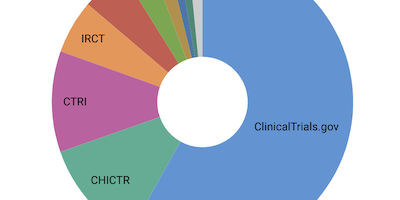
By default the tool uses the Dimensions COVID-19 dataset. The dataset is freely available on the Google Cloud Marketplace and contains all published articles and preprints, grants, clinical trials, and research datasets from Dimensions.ai that are related to COVID-19.
For more information, see the GitHub repository.
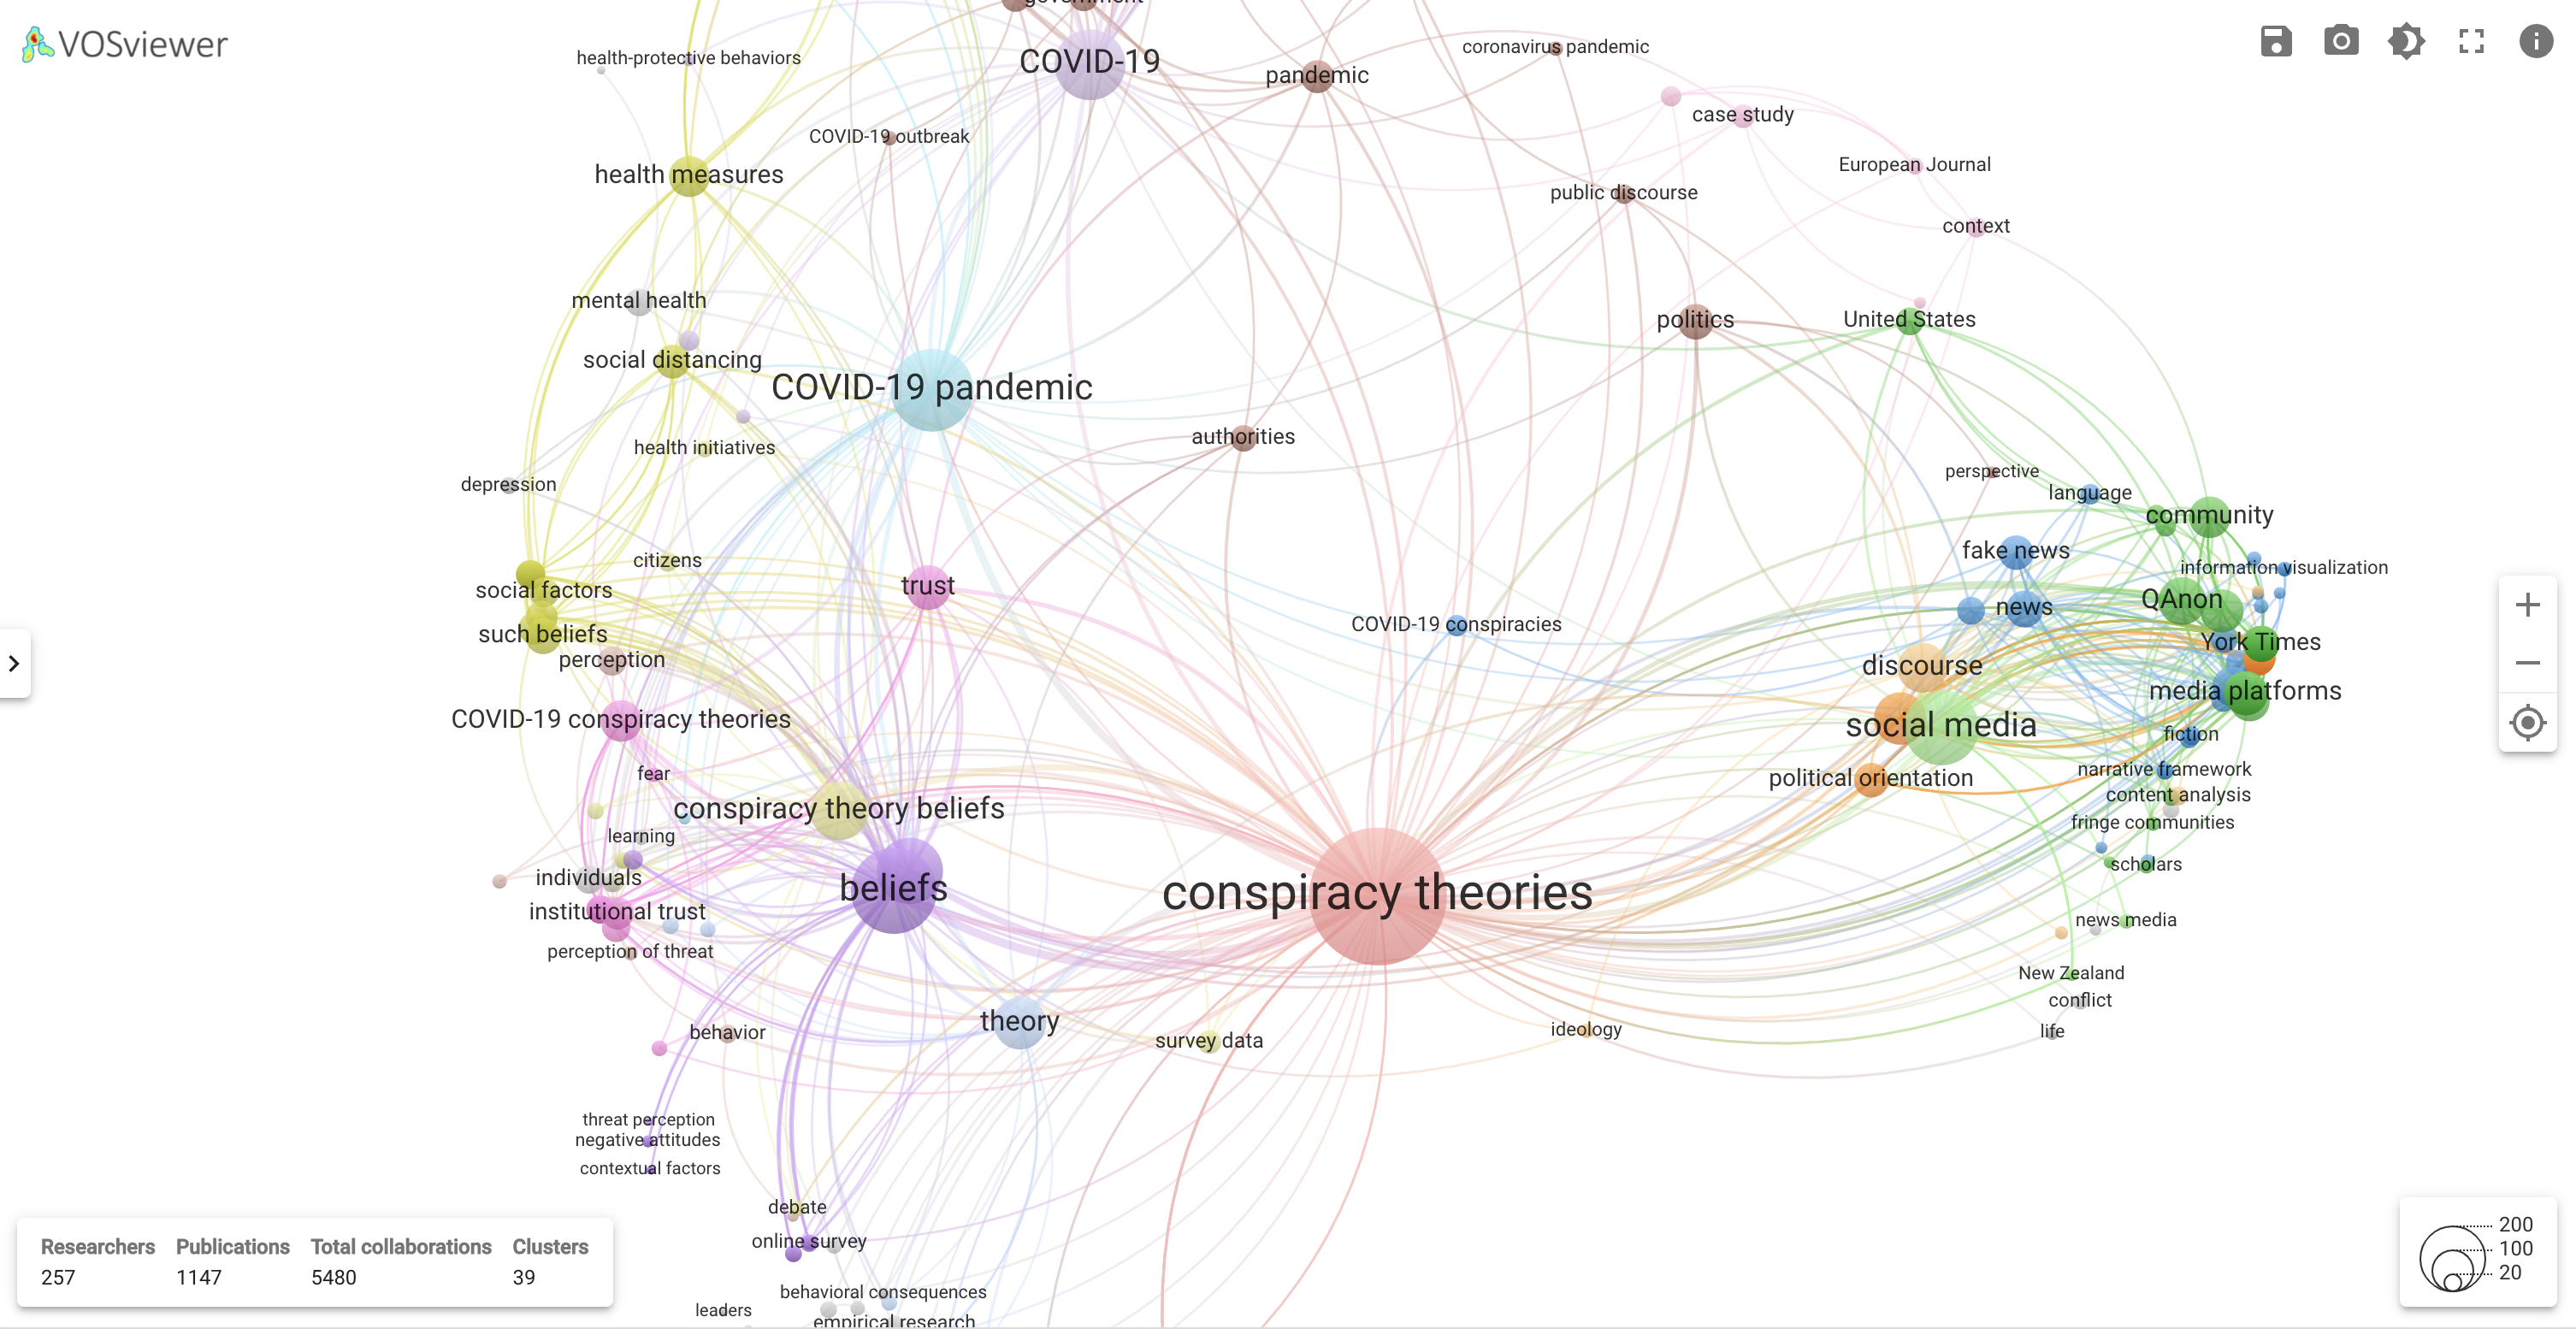
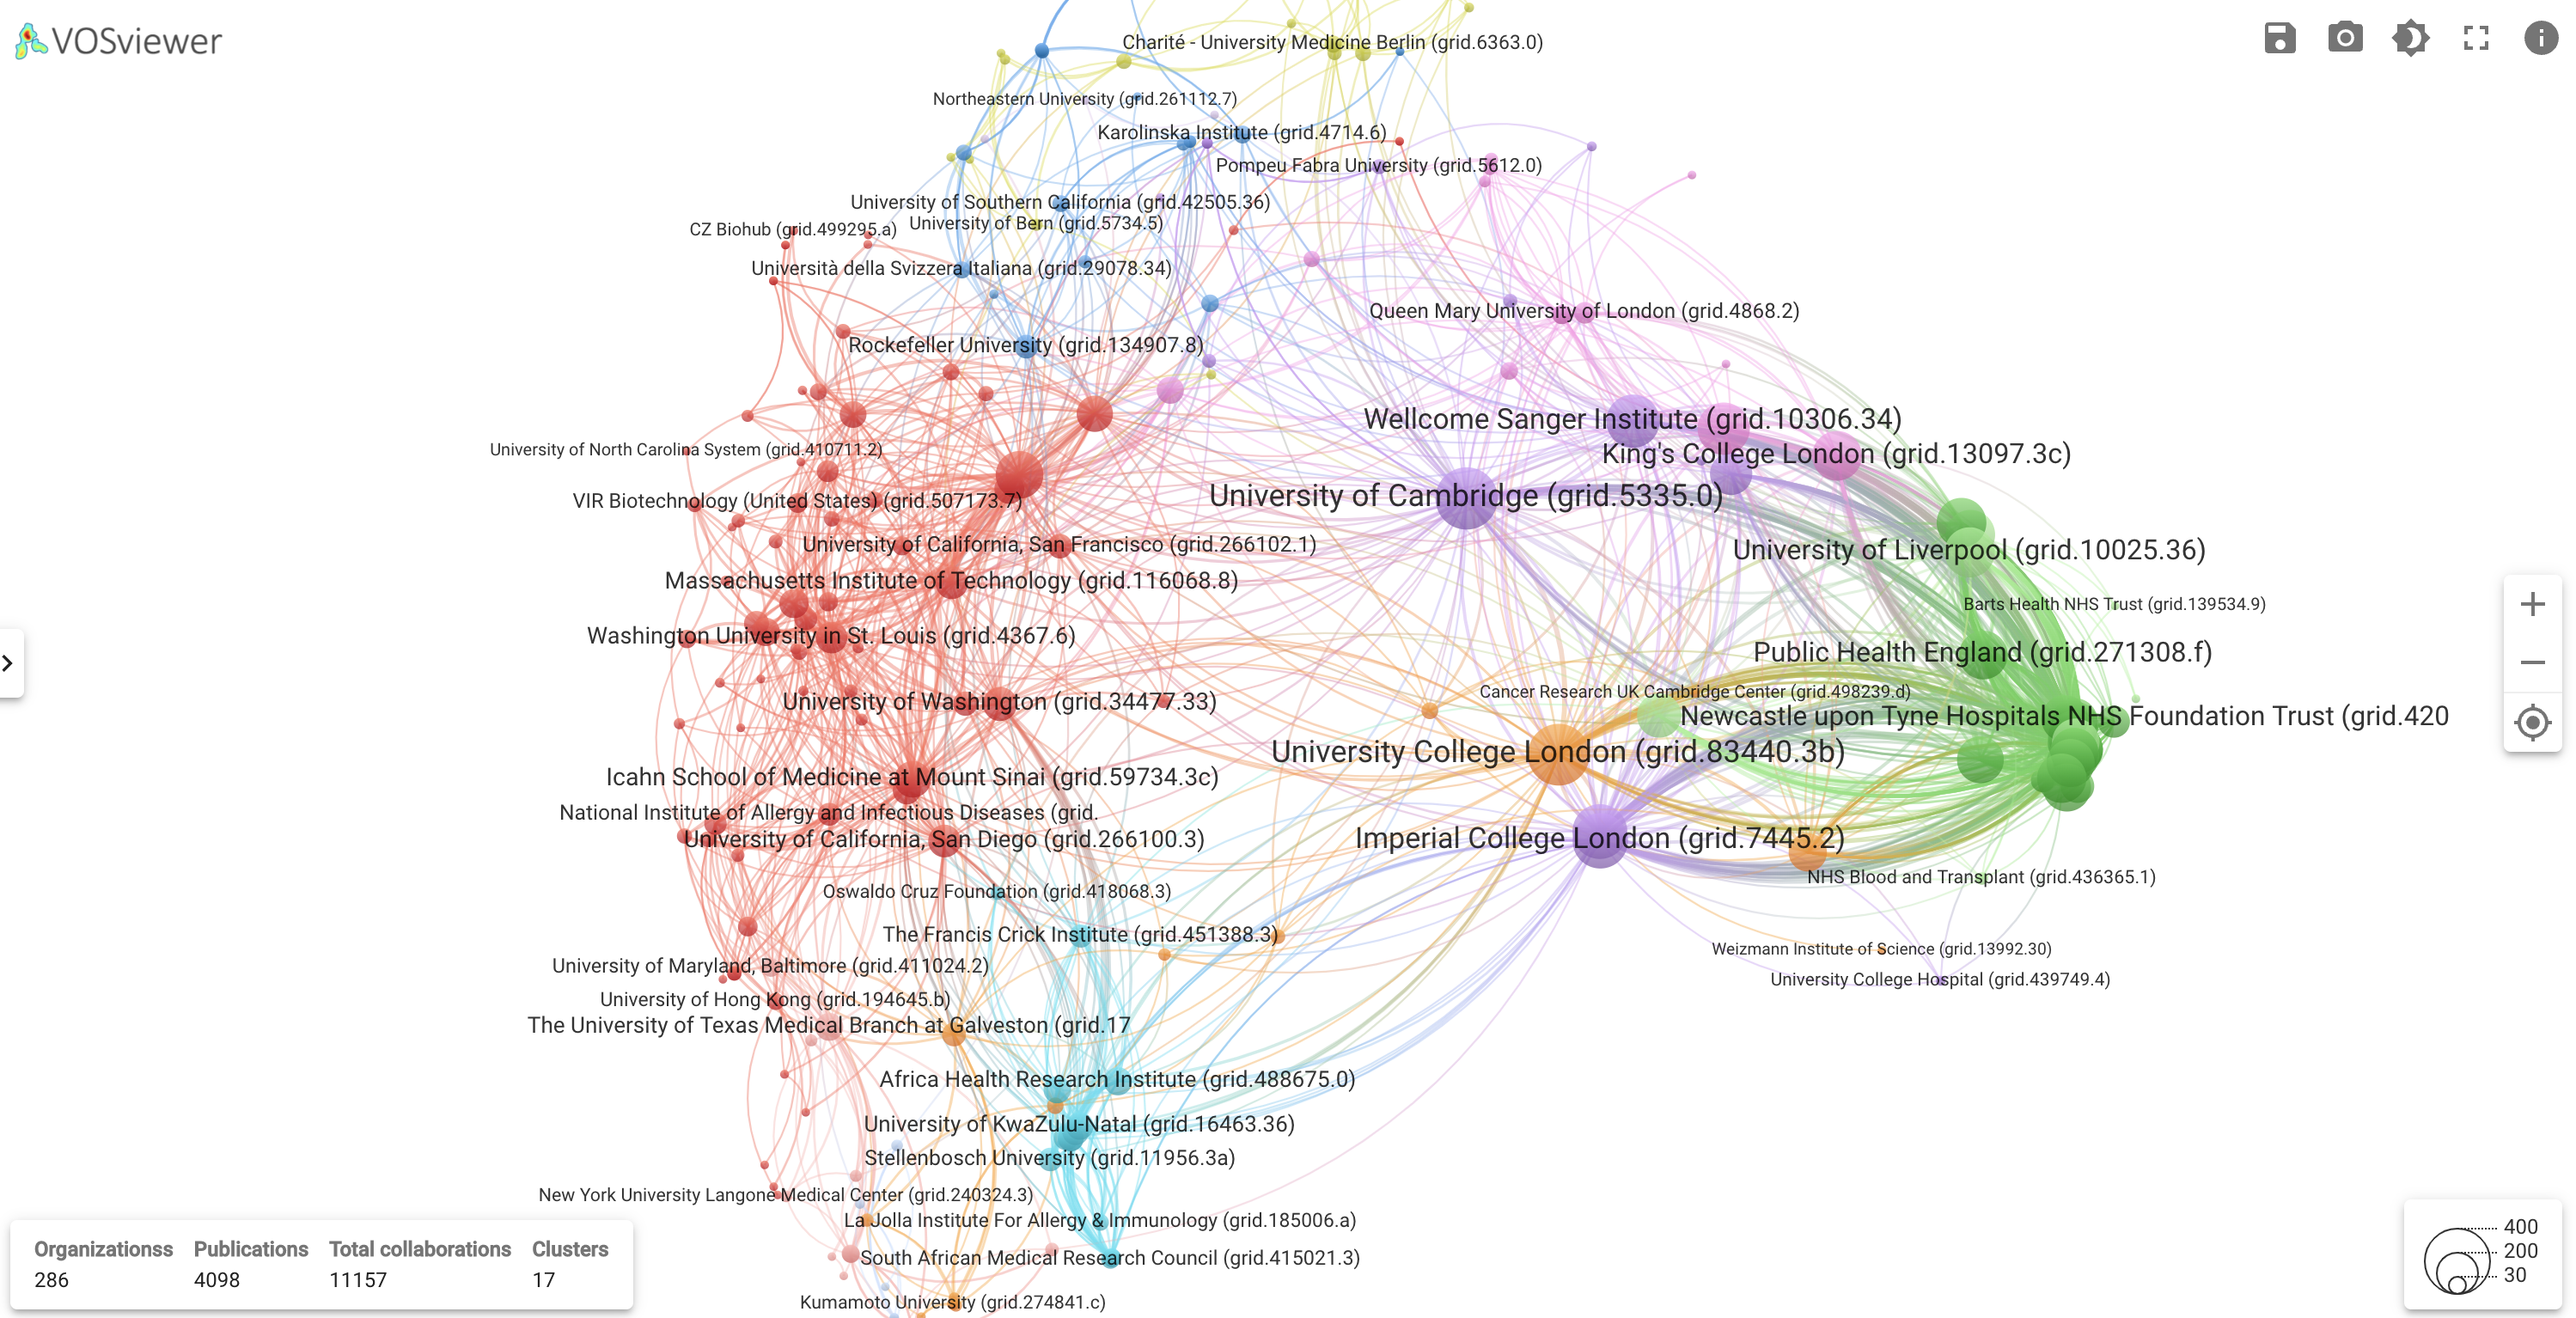
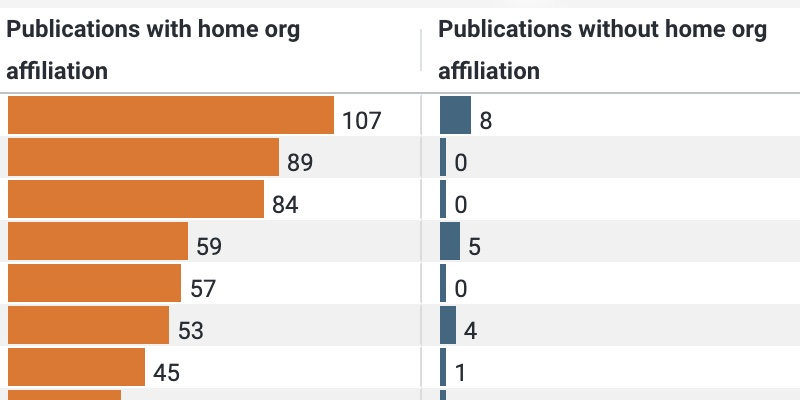
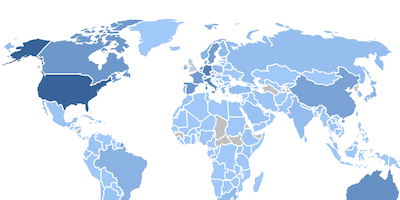
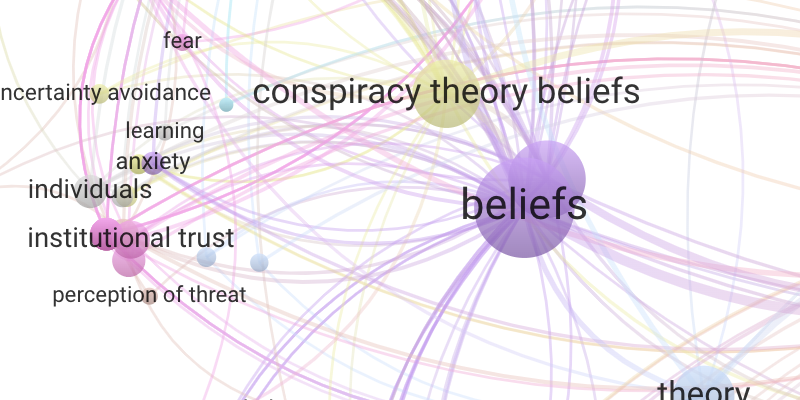
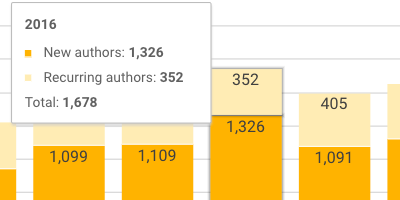
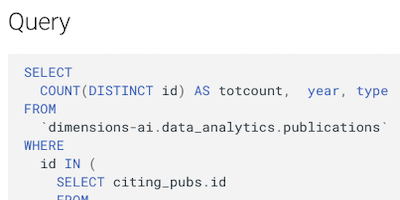
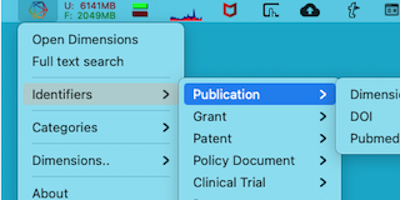
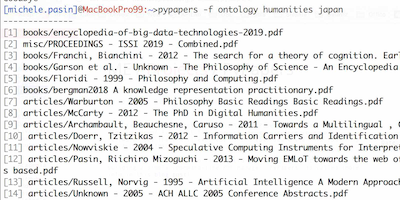
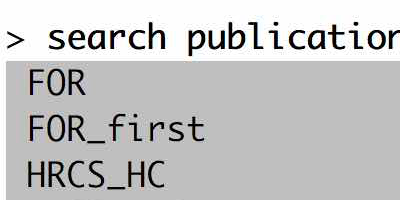
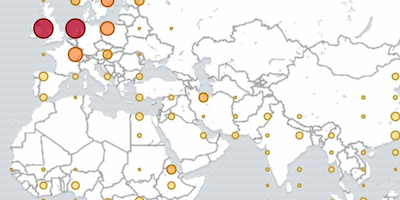
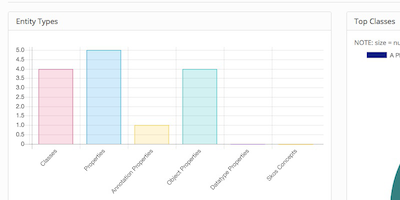
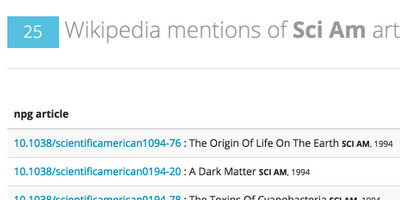
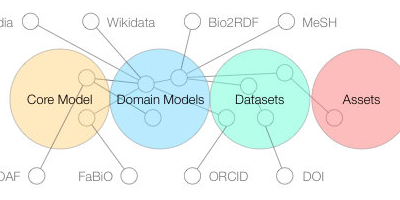
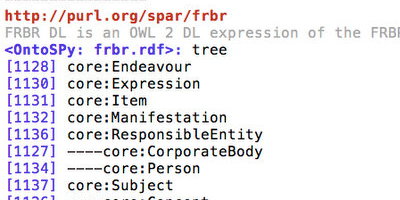
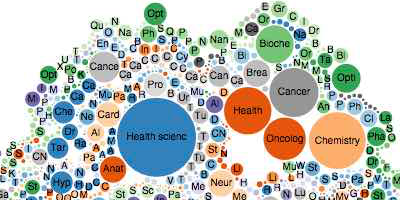
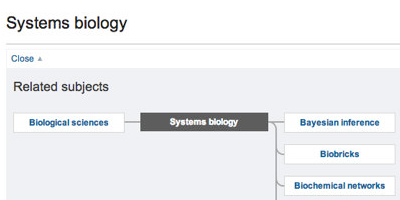
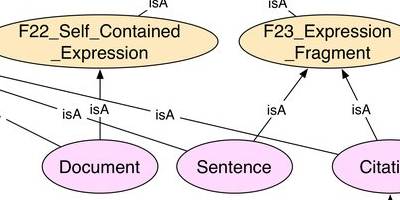
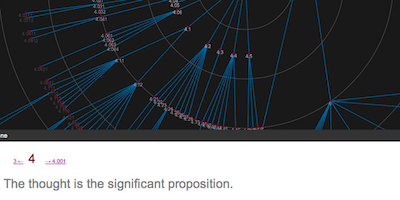
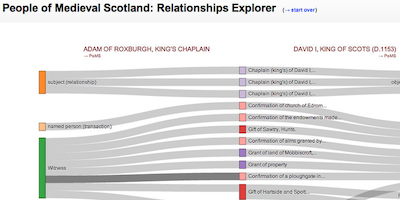
Screenshots: